Economic Factors
Click to enlarge image.
The Port of Vancouver USA reported total operating revenue of $52.734 million in 2023, generated primarily from its maritime terminal operations and its industrial/commercial property leases for businesses located within the port.
Steel import and agricultural export volumes were lower for ports throughout the U.S. last year due to tariffs, geopolitical conflicts, and other global market factors. While Port of Vancouver USA volumes reflected these impacts in 2023, its strategic diversification of cargo and business lines, investments in infrastructure, transportation connections and highly skilled workforce helped stabilize operating revenues and even contributed to record and near-record years in other products it handles.
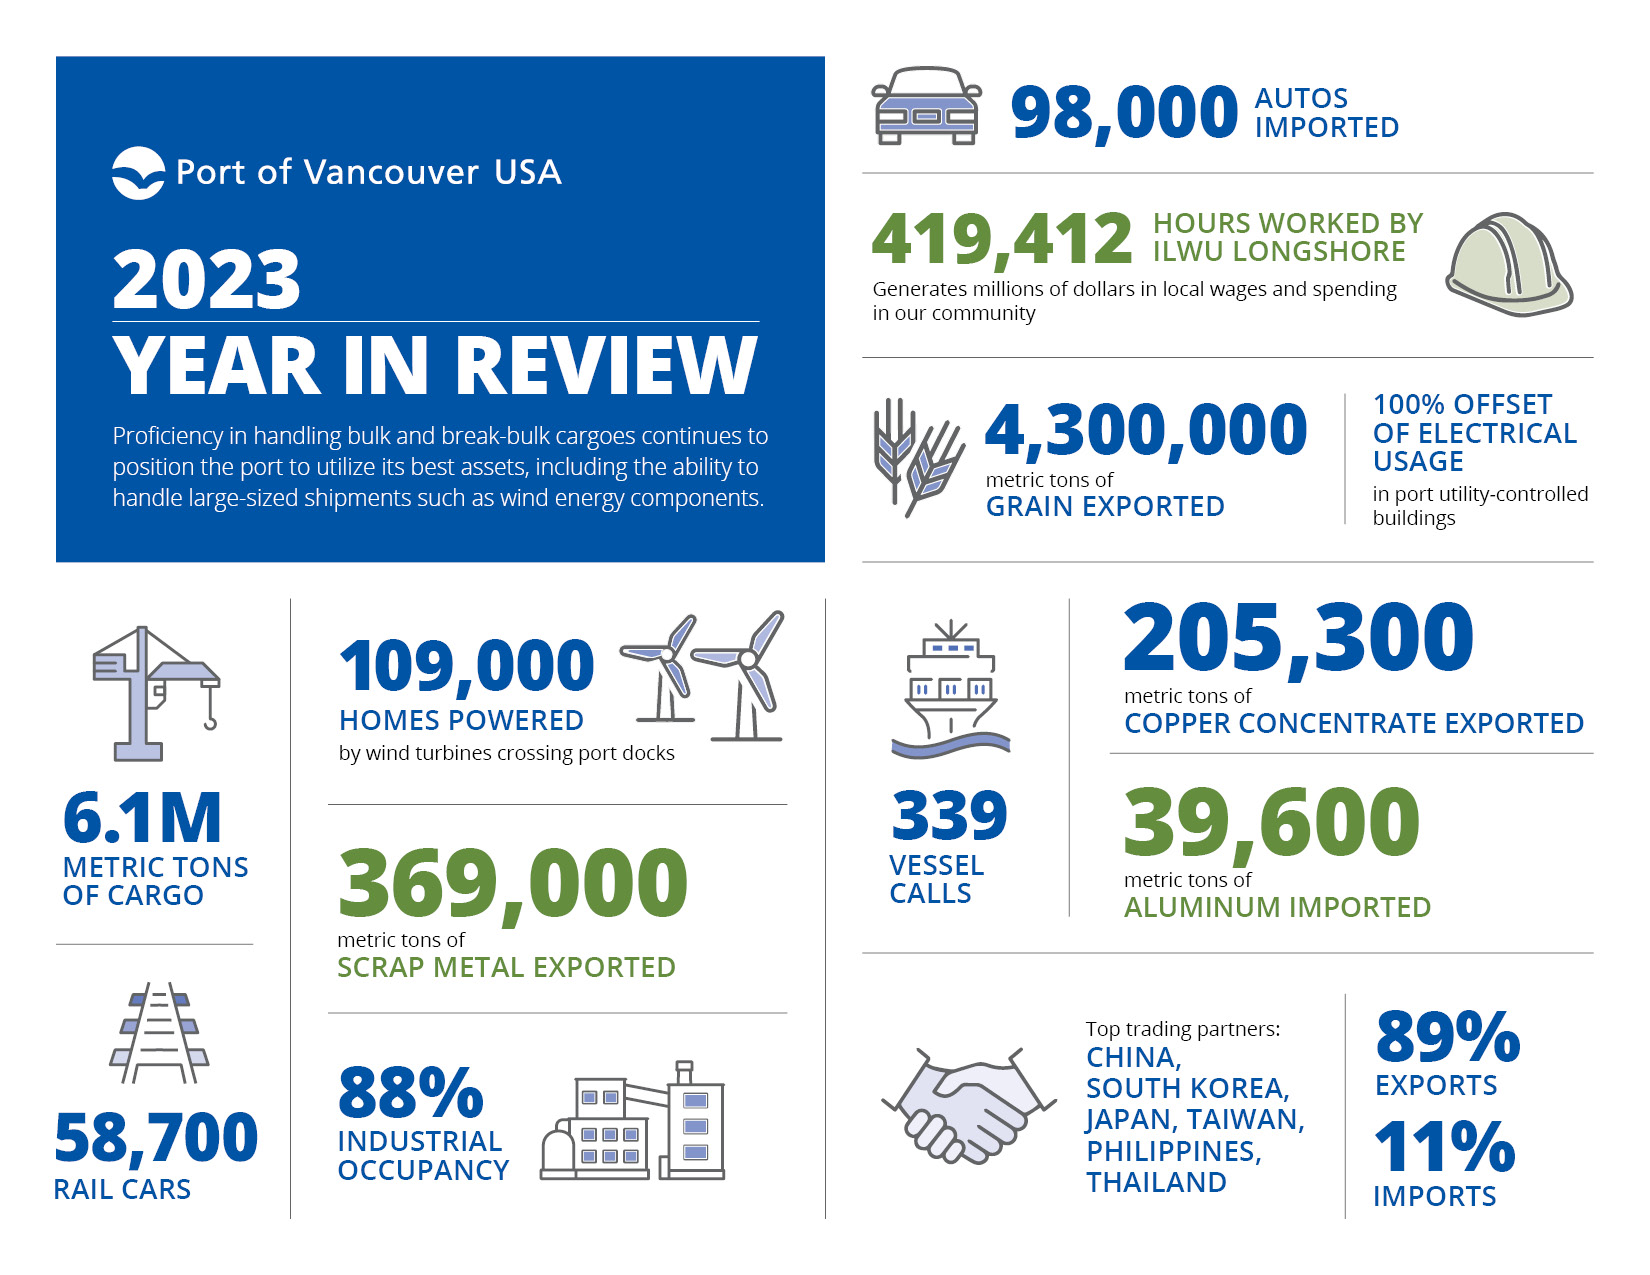
In total, more than 6.13 million metric tons of commodities moved through the port. Exports accounted for 5.44 million metric tons of that volume, including potash – a critical ingredient in fertilizer and a brand-new commodity to the port in 2023.
Capitalizing on the port’s rail and deep-water channel access on the Columbia River, more than 4.6 million metric tons of grain product were exported through the port’s grain terminal. A majority of the 58,784 rail cars that moved through the port in 2023 were destined for this facility, where wheat, soybeans, corn, and other grains were loaded onto vessels headed to the Philippines, Thailand, South Korea and other markets around the world.
The port continued to solidify its role as a leading gateway for the building blocks of green energy production, helping export 205,302 metric tons of copper concentrate used in manufacturing batteries that power electronics and electric equipment. In late 2023 it also announced a deal that in the coming years will make the Port of Vancouver USA a leading gateway for soda ash exports – an essential mineral in electric and hybrid vehicle production.
While the port is primarily export-focused, imports accounted for 693,760 metric tons for the year. The largest import commodities were sodium hydroxide and steel, though the port also maintained its position as the leading gateway for imports of wind energy infrastructure on the North American West Coast. In 2023, it moved its second-highest volume of wind energy components in the last decade at nearly 61,000 metric tons. The port also reported the largest-ever year for vehicle imports, handling more than 98,000.
Industrial and commercial occupancy was at 88 percent, where 50 tenant businesses engage in a range of products and services from food processing to manufacturing. These businesses employ thousands locally and contribute significantly to the local economy and tax base.
The multi-phase Terminal 1 project that is part of the Vancouver waterfront transformation continued in 2023. The demolition of the century-old dock began which included removal of 1,100 wooden piles, making way for a modern, seismically resilient dock in the coming years that will support a future public market.
The Terminal 1 dock removal process and ecological upgrades benefited from a $3.5 million state capital budget allocation in 2023. In the coming year, the designated Tax Increment Area encompassing Terminal 1 will take effect. The port worked in collaboration with the City of Vancouver and Clark County to implement and refine this tool to help finance the Terminal 1 redevelopment. The port continues to look for other resources to leverage its own investment in this effort that promises to return economic benefit to the entire community.
In 2021, the Washington State Legislature passed House Bill 1189, allowing certain municipalities to establish Tax Increment Areas (TIAs) to finance public improvements that spur new private development. TIAs redirect some property taxes to fund specific projects within their boundaries, without raising taxes. The Port of Vancouver USA established a TIA at Terminal 1, aiming to transform the industrial site into a vibrant waterfront destination. The port will complete several public projects using tax allocation revenues, attracting private developers to invest in the area. These projects are expected to cost over $36 million ($50.2 million adjusted for future inflation), with tax allocation revenues forecasted to be $49.1 million over 25 years. The TIA will receive taxes from certain levies while exempting others. The economic impact includes thousands of temporary and permanent jobs and substantial annual tax revenues. A legislative fix in 2023 (House Bill 1527) addressed issues with Tax Increment Financing, ensuring that privately owned improvements in TIAs are included in increment value calculations, thus enabling the Port’s TIA proposal to generate tax increment revenue. The port anticipates receiving is first TIA allocated revenues in 2024.
As outlined by its Climate Action Plan to achieve carbon neutrality by 2050, the port continued to upgrade its equipment and infrastructure to increase sustainability. It added five all-electric Ford Lightning trucks to its vehicle fleet and increased its use of renewable diesel in 2023. The port also finished a $18.6 million renovation of Terminal 5 where a brand-new Berth 17 offers shore power, an innovative technology that eliminates the need for ships to idle while docked, which will lower carbon emissions in the years ahead.
For the thirteenth year in a row, the port also purchased Renewable Energy Credits (RECs) equal to 100 percent of its purchased electricity.
2024 Budget
The 2024 budget projects operating revenues of $52.089 million, with 66 percent of the projected operating revenue coming from commercial activity, including industrial property leases, rail, and facilities. The 2024 budget projects operating expenses of $45.326 million, a $5.123 million increase over 2023 operating expenses. This increase is mainly due to an anticipated increase in terminal operating revenue and related expenses.
The 2024 capital budget will continue strong investments in the improvement of port facilities, which will produce significant regional economic activity. The port will perform tenant improvements, continue its waterfront development project, and undertake upgrades and maintenance to port infrastructure and IT systems. Financing for the 2024 capital program will come from marine and industrial revenues, tax levy revenue, grants, and other contributions.
3103 NW Lower River Road, Vancouver, WA 98660
PHONE360-693-3611 FAX360-735-1565 EMAIL info@portvanusa.com
SCROLL